
阅读(1773)
赞(0)
pyecharts Flask
2022-10-24 09:40:38 更新
本指南介绍了如何在 Flask 中使用 pyecharts。
Flask 模板渲染
Step 0: 新建一个 Flask 项目
$ mkdir pyecharts-flask-demo
$ cd pyecharts-flask-demo
$ mkdir templates
Step 1: 拷贝 pyecharts 模板
将 pyecharts 模板,位于 pyecharts.render.templates 拷贝至刚新建的 templates 文件夹
chenjiandongx@DESKTOP-E83NUHA:/mnt/d/Python/pyecharts-flask-demo/templates$ tree
.
├── jupyter_lab.html
├── jupyter_notebook.html
├── macro
├── nteract.html
├── simple_chart.html
├── simple_page.html
└── table.html
Step 2: 渲染图表
请将下面的代码保存为 server.py 文件并移至项目的根目录下。
目录结构如下
chenjiandongx@DESKTOP-E83NUHA:/mnt/d/Python/pyecharts-flask-demo$ tree -L 1
.
├── server.py
└── templates
示例代码
from flask import Flask
from jinja2 import Markup, Environment, FileSystemLoader
from pyecharts.globals import CurrentConfig
# 关于 CurrentConfig,可参考 [基本使用-全局变量]
CurrentConfig.GLOBAL_ENV = Environment(loader=FileSystemLoader("./templates"))
from pyecharts import options as opts
from pyecharts.charts import Bar
app = Flask(__name__, static_folder="templates")
def bar_base() -> Bar:
c = (
Bar()
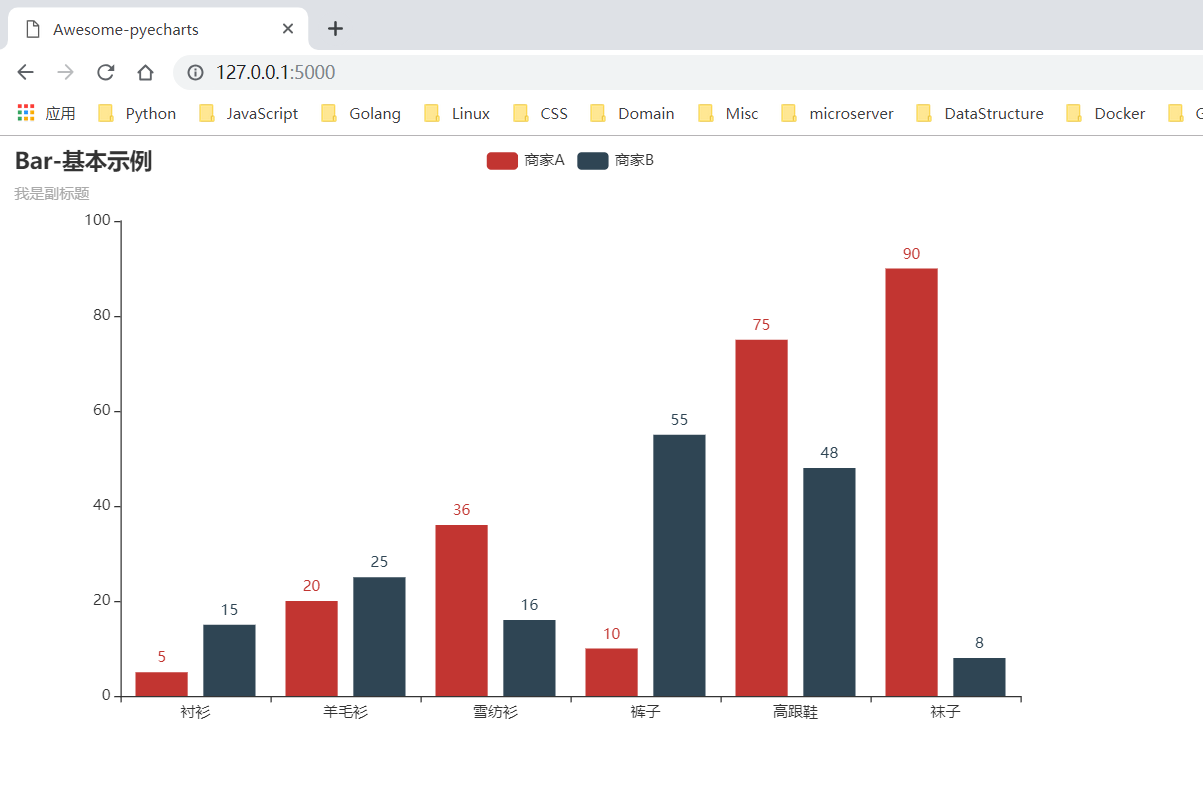
.add_xaxis(["衬衫", "羊毛衫", "雪纺衫", "裤子", "高跟鞋", "袜子"])
.add_yaxis("商家A", [5, 20, 36, 10, 75, 90])
.add_yaxis("商家B", [15, 25, 16, 55, 48, 8])
.set_global_opts(title_opts=opts.TitleOpts(title="Bar-基本示例", subtitle="我是副标题"))
)
return c
@app.route("/")
def index():
c = bar_base()
return Markup(c.render_embed())
if __name__ == "__main__":
app.run()Step 3: 运行项目
$ python server.py使用浏览器打开 http://127.0.0.1:5000 即可访问服务
Flask 前后端分离
前后端分离可以使用动态更新数据,增量更新数据等功能。
Step 0,Step 1 参见上面模板渲染章节内容
Step 3: 新建一个 HTML 文件
新建 HTML 文件保存位于项目根目录的 templates 文件夹,这里以如下 index.html 为例. 主要用到了 jquery 和 pyecharts 管理的 echarts.min.js 依赖
index.html
<!DOCTYPE html>
<html>
<head>
    <meta charset="UTF-8">
    <title>Awesome-pyecharts</title>
    <script src="https://cdn.bootcss.com/jquery/3.0.0/jquery.min.js" rel="external nofollow"  rel="external nofollow"  rel="external nofollow" ></script>
    <script type="text/javascript" src="https://assets.pyecharts.org/assets/echarts.min.js" rel="external nofollow"  rel="external nofollow"  rel="external nofollow" ></script>
</head>
<body>
    <div id="bar" style="width:1000px; height:600px;"></div>
    <script>
        $(
            function () {
                var chart = echarts.init(document.getElementById('bar'), 'white', {renderer: 'canvas'});
                $.ajax({
                    type: "GET",
                    url: "http://127.0.0.1:5000/barChart",
                    dataType: 'json',
                    success: function (result) {
                        chart.setOption(result);
                    }
                });
            }
        )
    </script>
</body>
</html>
Step 4: 编写 flask 和 pyecharts 代码渲染图表
请将下面的代码保存为 app.py 文件并移至项目的根目录下。
目录结构如下
sunhailindeMacBook-Pro:pyecharts_flask sunhailin$ tree -L 1
.
├── app.py
└── templates
注: 目前由于 json 数据类型的问题,无法将 pyecharts 中的 JSCode 类型的数据转换成 json 数据格式返回到前端页面中使用。因此在使用前后端分离的情况下尽量避免使用 JSCode 进行画图。
app.py
from random import randrange

from flask import Flask, render_template

from pyecharts import options as opts
from pyecharts.charts import Bar


app = Flask(__name__, static_folder="templates")


def bar_base() -> Bar:
    c = (
        Bar()
        .add_xaxis(["衬衫", "羊毛衫", "雪纺衫", "裤子", "高跟鞋", "袜子"])
        .add_yaxis("商家A", [randrange(0, 100) for _ in range(6)])
        .add_yaxis("商家B", [randrange(0, 100) for _ in range(6)])
        .set_global_opts(title_opts=opts.TitleOpts(title="Bar-基本示例", subtitle="我是副标题"))
    )
    return c


@app.route("/")
def index():
    return render_template("index.html")


@app.route("/barChart")
def get_bar_chart():
    c = bar_base()
    return c.dump_options_with_quotes()


if __name__ == "__main__":
    app.run()
Step 5: 运行项目
$ python app.py使用浏览器打开 http://127.0.0.1:5000 即可访问服务
定时全量更新图表
前端主动向后端进行数据刷新
定时刷新的核心在于 HTML 的 setInterval 方法。
index.html
<!DOCTYPE html>
<html>
<head>
    <meta charset="UTF-8">
    <title>Awesome-pyecharts</title>
    <script src="https://cdn.bootcss.com/jquery/3.0.0/jquery.min.js" rel="external nofollow"  rel="external nofollow"  rel="external nofollow" ></script>
    <script type="text/javascript" src="https://assets.pyecharts.org/assets/echarts.min.js" rel="external nofollow"  rel="external nofollow"  rel="external nofollow" ></script>

</head>
<body>
    <div id="bar" style="width:1000px; height:600px;"></div>
    <script>
        var chart = echarts.init(document.getElementById('bar'), 'white', {renderer: 'canvas'});

        $(
            function () {
                fetchData(chart);
                setInterval(fetchData, 2000);
            }
        );

        function fetchData() {
            $.ajax({
                type: "GET",
                url: "http://127.0.0.1:5000/barChart",
                dataType: 'json',
                success: function (result) {
                    chart.setOption(result);
                }
            });
        }
    </script>
</body>
</html>
定时增量更新图表
index.html
<!DOCTYPE html>
<html>
<head>
    <meta charset="UTF-8">
    <title>Awesome-pyecharts</title>
    <script src="https://cdn.bootcss.com/jquery/3.0.0/jquery.min.js" rel="external nofollow"  rel="external nofollow"  rel="external nofollow" ></script>
    <script type="text/javascript" src="https://assets.pyecharts.org/assets/echarts.min.js" rel="external nofollow"  rel="external nofollow"  rel="external nofollow" ></script>

</head>
<body>
    <div id="bar" style="width:1000px; height:600px;"></div>
    <script>
        var chart = echarts.init(document.getElementById('bar'), 'white', {renderer: 'canvas'});
        var old_data = [];
        $(
            function () {
                fetchData(chart);
                setInterval(getDynamicData, 2000);
            }
        );

        function fetchData() {
            $.ajax({
                type: "GET",
                url: "http://127.0.0.1:5000/lineChart",
                dataType: "json",
                success: function (result) {
                    chart.setOption(result);
                    old_data = chart.getOption().series[0].data;
                }
            });
        }

        function getDynamicData() {
            $.ajax({
                type: "GET",
                url: "http://127.0.0.1:5000/lineDynamicData",
                dataType: "json",
                success: function (result) {
                    old_data.push([result.name, result.value]);
                    chart.setOption({
                        series: [{data: old_data}]
                    });
                }
            });
        }

    </script>
</body>
</html>
增量更新后端代码也需要相应的改变
from random import randrange
from flask.json import jsonify
from flask import Flask, render_template
from pyecharts import options as opts
from pyecharts.charts import Line
app = Flask(__name__, static_folder="templates")
def line_base() -> Line:
line = (
Line()
.add_xaxis(["{}".format(i) for i in range(10)])
.add_yaxis(
series_name="",
y_axis=[randrange(50, 80) for _ in range(10)],
is_smooth=True,
label_opts=opts.LabelOpts(is_show=False),
)
.set_global_opts(
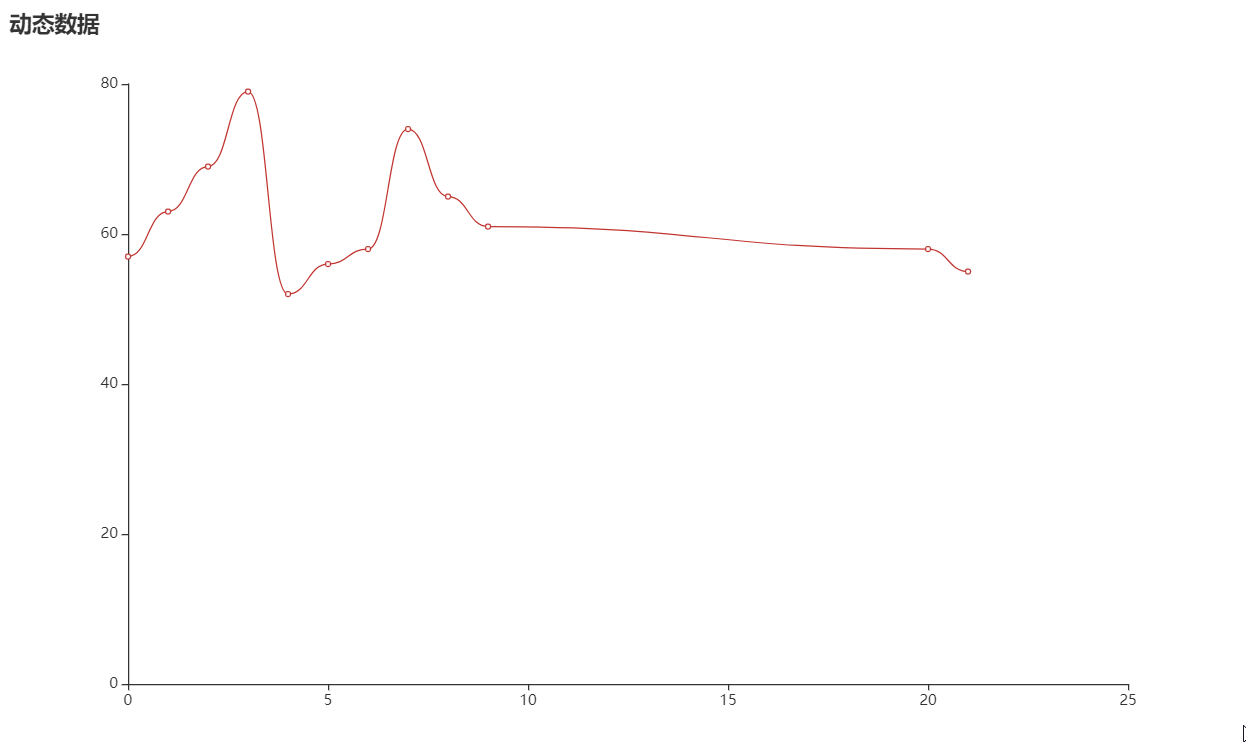
title_opts=opts.TitleOpts(title="动态数据"),
xaxis_opts=opts.AxisOpts(type_="value"),
yaxis_opts=opts.AxisOpts(type_="value"),
)
)
return line
@app.route("/")
def index():
return render_template("index.html")
@app.route("/lineChart")
def get_line_chart():
c = line_base()
return c.dump_options_with_quotes()
idx = 9
@app.route("/lineDynamicData")
def update_line_data():
global idx
idx = idx + 1
return jsonify({"name": idx, "value": randrange(50, 80)})
if __name__ == "__main__":
app.run()